00:00:00:00
Roughcut
Next clip/
Home
Reading a retention graph without fooling yourself
Maya Reyes8 min read
Dips, bumps and the flat line everyone wants: what each shape in the graph is telling you about the edit.

A retention graph is the audience editing your video after the fact. Every shape in it points at a moment in the timeline, and most of them can be fixed in the next edit.
Dips
A sharp dip marks a moment viewers skipped. A slow slope marks a section that ran long. They need different fixes: cut the first, re-pace the second.
Bumps
A bump is a rewatch. Find out what was on screen. It is usually a number, a reveal or a line people wanted to hear twice, and it tells you what the next video should open with.
The cliff at the start
Every graph falls in the first thirty seconds. What matters is where it lands. If it lands under 60%, the opening promised something the video took too long to deliver.
- Compare the title and thumbnail with the first sentence
- Check how long it takes to reach the first piece of proof
- Look for an intro that could be removed entirely
The flat line
A flat middle is the goal, and it is built in the edit: a new angle, a graphic, a question or a change in sound every twenty to forty seconds. We call them pattern breaks and we mark them on the timeline before we cut.
You cannot fix a graph. You can only fix the next video using this one.
Do not compare across lengths
A four-minute video at 60% and a twenty-minute video at 45% may be the same quality of edit. Compare each video with others of its own length, and watch the direction over ten uploads rather than the result of one.
Reading a retention graph without fooling yourself
Maya Reyes8 min read
Dips, bumps and the flat line everyone wants: what each shape in the graph is telling you about the edit.
A retention graph is the audience editing your video after the fact. Every shape in it points at a moment in the timeline, and most of them can be fixed in the next edit.
Dips
A sharp dip marks a moment viewers skipped. A slow slope marks a section that ran long. They need different fixes: cut the first, re-pace the second.
Bumps
A bump is a rewatch. Find out what was on screen. It is usually a number, a reveal or a line people wanted to hear twice, and it tells you what the next video should open with.
The cliff at the start
Every graph falls in the first thirty seconds. What matters is where it lands. If it lands under 60%, the opening promised something the video took too long to deliver.
- Compare the title and thumbnail with the first sentence
- Check how long it takes to reach the first piece of proof
- Look for an intro that could be removed entirely
The flat line
A flat middle is the goal, and it is built in the edit: a new angle, a graphic, a question or a change in sound every twenty to forty seconds. We call them pattern breaks and we mark them on the timeline before we cut.
You cannot fix a graph. You can only fix the next video using this one.
Do not compare across lengths
A four-minute video at 60% and a twenty-minute video at 45% may be the same quality of edit. Compare each video with others of its own length, and watch the direction over ten uploads rather than the result of one.
Reading a retention graph without fooling yourself
Maya Reyes8 min read
Dips, bumps and the flat line everyone wants: what each shape in the graph is telling you about the edit.
A retention graph is the audience editing your video after the fact. Every shape in it points at a moment in the timeline, and most of them can be fixed in the next edit.
Dips
A sharp dip marks a moment viewers skipped. A slow slope marks a section that ran long. They need different fixes: cut the first, re-pace the second.
Bumps
A bump is a rewatch. Find out what was on screen. It is usually a number, a reveal or a line people wanted to hear twice, and it tells you what the next video should open with.
The cliff at the start
Every graph falls in the first thirty seconds. What matters is where it lands. If it lands under 60%, the opening promised something the video took too long to deliver.
- Compare the title and thumbnail with the first sentence
- Check how long it takes to reach the first piece of proof
- Look for an intro that could be removed entirely
The flat line
A flat middle is the goal, and it is built in the edit: a new angle, a graphic, a question or a change in sound every twenty to forty seconds. We call them pattern breaks and we mark them on the timeline before we cut.
You cannot fix a graph. You can only fix the next video using this one.
Do not compare across lengths
A four-minute video at 60% and a twenty-minute video at 45% may be the same quality of edit. Compare each video with others of its own length, and watch the direction over ten uploads rather than the result of one.
More notes
Notes from the timeline.
What we learn cutting a few hundred videos a month, written down so your next upload holds longer.
All notes- Short form00:06:00
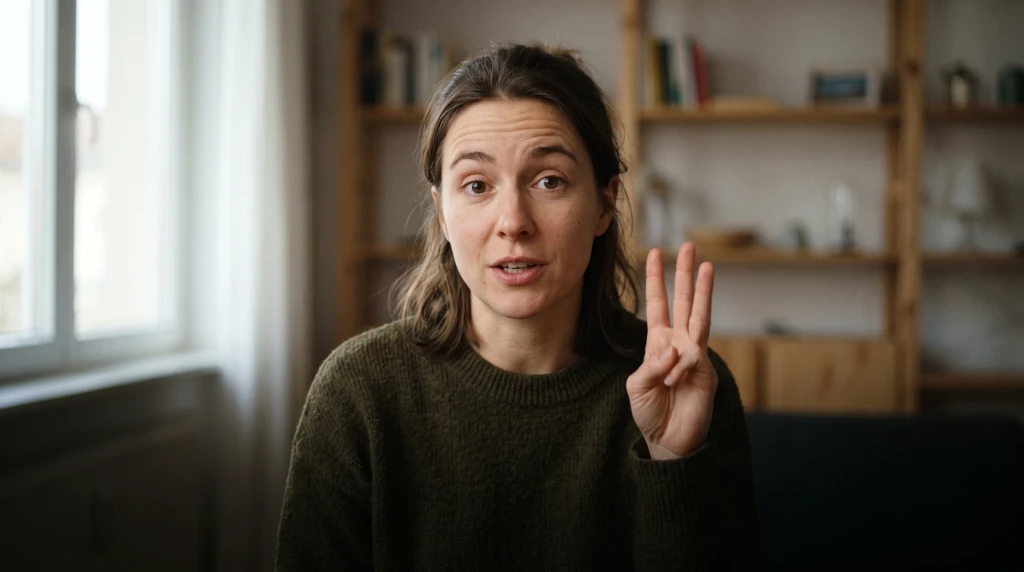 6 min read
The first three seconds, frame by frame
What happens in the opening of a short video that holds 80% of its viewers, and what happens in one that loses half.
Ria Sen - Process00:05:00
 5 min read
How to send footage an editor can use
Five habits that save a day on every edit: file names, a brief in four lines, room tone and two more.
Maya Reyes - YouTube00:08:00
 8 min read
Reading a retention graph without fooling yourself
Dips, bumps and the flat line everyone wants: what each shape in the graph is telling you about the edit.
Maya Reyes
More notes
Notes from the timeline.
What we learn cutting a few hundred videos a month, written down so your next upload holds longer.
All notes- Short form00:06:006 min read
The first three seconds, frame by frame
What happens in the opening of a short video that holds 80% of its viewers, and what happens in one that loses half.
Ria Sen - Process00:05:005 min read
How to send footage an editor can use
Five habits that save a day on every edit: file names, a brief in four lines, room tone and two more.
Maya Reyes - YouTube00:08:008 min read
Reading a retention graph without fooling yourself
Dips, bumps and the flat line everyone wants: what each shape in the graph is telling you about the edit.
Maya Reyes
More notes
Notes from the timeline.
What we learn cutting a few hundred videos a month, written down so your next upload holds longer.
All notes- Short form00:06:006 min read
The first three seconds, frame by frame
What happens in the opening of a short video that holds 80% of its viewers, and what happens in one that loses half.
Ria Sen - Process00:05:005 min read
How to send footage an editor can use
Five habits that save a day on every edit: file names, a brief in four lines, room tone and two more.
Maya Reyes - YouTube00:08:008 min read
Reading a retention graph without fooling yourself
Dips, bumps and the flat line everyone wants: what each shape in the graph is telling you about the edit.
Maya Reyes

Your turn
Send the footage.
Upload the raw files today. The first cut is back before the week is out, with the hook rebuilt and the captions in.
- 1,900+videos cut
- 72 hto the first cut
- 4.9 / 5client rating
Sample projects
Your turn
Send the footage.
Upload the raw files today. The first cut is back before the week is out, with the hook rebuilt and the captions in.
- 1,900+videos cut
- 72 hto the first cut
- 4.9 / 5client rating
Sample projects
Your turn
Send the footage.
Upload the raw files today. The first cut is back before the week is out, with the hook rebuilt and the captions in.
- 1,900+videos cut
- 72 hto the first cut
- 4.9 / 5client rating
Sample projects